Image may be NSFW. Clik here to view. The next Cologne R user group meeting is scheduled for this Friday, 6 March 2014 and we have an exciting agenda with two talks, followed by networking drinks:
MS Office and Excel are the 'de-facto' standards in many industries. Using R with Excel offers an opportunity to combine the statistical power of R with a familiar user interface. R.net offers a user friendly interfaces to Excel; R functions work just like Excel functions and are basically hidden away.
In addition to the analysis of numerical data, R is increasingly attractive for processing text as well. Cornelius will give a very brief overview of common text mining techniques and their corresponding R implementations, with a focus on useful applications in the social sciences. Techniques will include corpus creation and management (package tm), latent semantic analysis (package lsa), and topic models (package topicmodels), as well as sentiment analysis (experimental package syuzhet). Simple but useful routines such as automatically inferring the language of a text (package text cat , or the gender of a first name (package genderize) will also be briefly pointed out.
Drinks and Networking
The event will be followed by drinks and schnitzel at the Lux.
For further details visit our KölnRUG Meetup site. Please sign up if you would like to come along. Notes from past meetings are available here.
Given all the attention the internet has given to the colors of this dress, I thought it would be interesting to look at the capabilities for extracting colors in R.
R has a number of packages for importing images in various file formats, including PNG, JPG, TIFF, and BMP. (The readbitmap package works with all of these.) In each case, the result is a 3-dimensional R array containing a 2-D image layer for each of the color channels (for example red, green and blue for color images). You can then manipulate the array as ordinary data to extract color information. For example, Derek Jones used the readPNG function to extract data from published heatmaps when the source data has been lost.
Photographs typically contain thousands or even millions of unique colors, but a very human question is: what are the major colors in the image? In other words, what is the image's palette? This is a difficult question to answer, but Russell Dinnage used R's k-means clustering capabilities to extract the 3 (or 4 or 6 — you decide) most prominent colors from an image, without including almost-identical shades of the same color and filtering out low-saturation background colors (like gray shadows). Without any supervision, his script can easily extract 6 colors from this tail of this beautiful peacock spider. In fact, his script generates five representative palettes:
So I guess it was black and blue after all! (Plus a heavy dose of white in the background)
Christophe Cariou used a similar palette-extraction process in R and applied it to every cover of Wired magazine since 1993. For each cover he extracted the 4 major colors, and then represented them all on this beautiful scatter diagram arranged on the color wheel:
Hello world. It’s been a long time since I posted anything here on my blog. I’ve been busy getting my Masters degree in statistical computing and I haven’t had much free time to blog. But I’ve writingRcode as much as ever. Now, with graduation approaching, I’m job hunting and I thought it would be good to put together a few things to show potential employers. In the spirit of open source, I want to share these “portfolio” scripts with anyone that’s interested.
As I’m sure many statisticians do, I keep a folder of “stock code”, or template scripts that do different things. This folder is always growing and the scripts are always improving, but there are a few in there that I think are worth sharing. Some of these are templates for common analyses, while others are just reminders of how to use a couple of commands to accomplish a practical task.
This post is of the latter type. I’m going to discuss fetching data from a URL.
Why might one need to fetch data from a URL?
You want to share your code with someone who isn’t familiar with R and you want to avoid the inevitable explanation of how to change the file path at the beginning of the file. (“Make sure you only use forward slashes!”)
The data at the URL is constantly changing and you want your analysis to use the latest each time you run it.
You want the code to just work when it’s run from another machine with another directory tree.
You want to post a completely repeatable analysis on your blog and you don’t want it to begin with “go to www.blahblahblah.com, download this data, and load it into R”.
Whatever your reason may be, it’s a neat trick, but it’s not one I use so often that I can just rattle off the code for it from memory. So here’s my template. I hope it can help someone else.
Caveat!!!
This is only for data that is in tabular form already. This is not for web scraping (i.e. extracting a table of data from a Wikipedia page.) There areentire packages devoted to that. This is for the simplest of all cases where there is a .csv file or a .txt file (or similar) at a URL and you want to read it into R directly from that URL without the intermediate step of saving it somewhere on your computer.
Using data.table’s fread()
I love the data.tablepackage. I use it every day, for almost every project I do. It’s an extension of the data.frame object class in R that makes many improvements. One of those improvements is in the function fread(). It’s data.table’s answer to base R’s read.csv(). It does many things better, but here I’m only going to address its ability to read data right from the web. As a primer, its typical use on a data file residing on your computer would look something like this:
Now if you actually navigate to that link in your browser, you won’t see anything, but a download dialog should pop up. If you navigate to the parent directory of that address, http://www.stats.ox.ac.uk/pub/datasets/csb you will see some text further down the page you will see several links to data files. Each of these links launches a download dialog when clicked. To grab the URL of the data file to pass to fread(), right click the link and select “Copy link address”. Other data files online might appear in the browser instead of launching download dialog, like this one a professor of mine had us use for an assignment. fread() handles these URLs just the same.
fread() makes smart decisions about how to read the data in (it detects column names and classes and so on), but the command has several arguments for specifying such things as well that you can use at your own discrimination. I find fread('filename') almost always just works, but sometimes there are reasons to be more explicit when reading data in.
Using RStudio
If you’re not familiar with RStudio, you are a true R novice. If you know what it is, but don’t use it, skip ahead.
In RStudio, you can click “Tools” -> “Import Dataset” -> “From Web URL” and a dialog will pop up asking you for a URL. Paste a URL into the dialog box (let’s just use the same one as before: http://www.stats.ox.ac.uk/pub/datasets/csb/ch11b.dat) and click “OK”. A nice little window pops up and allows you to specify how the data should be read and what name the object should be given in R. When you click “Import”, the data is read in and some code appears in the console. What this interface does is download the data to a temporary file in a temporary folder and then read it in. The downloaded data file persists on your hard drive as long as your R session lasts, but disappears as soon as your R session ends.
This is handy, but if you wanted to repeat the process, you would have to click through the menu again and supply the data URL again. This isn’t exactly “repeatable” in the Stack Overflow sense of the word.
Using RCurl’s getURL()
The RCurl package provides bindings to the cURLlibrary. This is a C library for web connections. The cURL library does way more than we need for this task and frankly, I don’t understand a lot of it. I saved RCurl for last because iI usually try fread() first, and then if I get some sort of error, I resort to RCurl. Take for example the data set at this link: https://sakai.unc.edu/access/content/group/3d1eb92e-7848-4f55-90c3-7c72a54e7e43/public/data/bycatch.csv (also posted by a professor for an assignment of mine). If you try to fread() it, no dice. I have no idea what that error message means, but here’s how to get that data set in anyway.
What are the arguments ssl.verifyhost=F and ssl.verifypeer=F doing? To be quite honest, I don’t really know. But if I’m having trouble reading from a URL I try specifying these arguments and changing one or both to FALSE almost always circumvents whatever error I’m getting.
This grabs the content residing at the specified URL, but doesn’t return a data.frame object. It has simply put the URL’s content into a string.
class(myfile)
[1] "character"
So how to get this into a data.frame object? We’ll use textConnection() to open a “connection” with the string, much like you would open a connection with a file on your hard drive in order to read it. Then we’ll have read.csv() (or you could use read.table() or fread() or similar) to read the string object like a text file and create a data.frame object.
   Season  Area Gear.Type  Time Tows Bycatch
1 1989-90 North    Bottom   Day   48       0
2 1989-90 North    Bottom Night    6       0
3 1989-90 North Mid-Water Night    1       0
4 1989-90 South    Bottom   Day  139       0
5 1989-90 South Mid-Water   Day    6       0
6 1989-90 South    Bottom Night    6       0
And there you have it. The data from the URL is now in a data.frame and ready to go.
Aside: read.csv() is just a vesion of read.table() with argument defaults such as sep = "," that make sense for reading .csv files.
A Use Case
Let’s pretend I want to automate something having to do with weather in Chicago. Maybe it’s a knitr document that I have scheduled to re-knit every night on my server. Every time the script re-runs, it should somehow take into account recent weather in Chicago. Weather Undergroundoffers historic (and an hour ago counts as “historic”) hourly weather data for many different locations. Many of these locations are airports, which for obvious reasons, have several meteorological sensors on site. On the Weather Underground page you can select a location and a date and see hourly weather for that calendar day. At the bottom of the page, you can click “Comma Delimited File” to see the data in comma delimited format - perfect for reading into R.
I see that the four letter airport code for Chicago is “KMDW” and after clicking through a few of these URLs, I see the stuff after “DailyHistory.html” doesn’t change. So if I know the date, I can construct the URL where the hourly Chicago airport wether for that date can be found in .csv format.
First, I define the beginning and end of the URL, which never change.
There is opportunity here to generalize this for many locations if one simply maps the four letter codes to other locations of interest usingswitch() or similar.
Then I ask the system for todays date and from it produce a string having format year/month/day.
Finally I grab the content of the webpage at that URL using the RCurl method described above. I choose getURL() instead of fread() for good reason; I’ll need to do some find-and-replace to clean up some html artifacts in the data and that is more efficient to do on one big string rather than on a bunch of individual values in a data.frame.
url_content<-getURL(url2fetch)
Now I have the content of the page in a string and I want to read that string into a data.frame object, but every line of the data ends with an html newline (“<br />”) and a text newline (“n”). read.csv() will recognize the “n” as a signal to start a new row of the data.frame, but the “<br />” isn’t recognized and will be appended to the value in the last column of every row. So let’s take care of this before read.csv() ever gets involved. I’ll do a simple find-and-replace where I find “<br />” and replace it with an empty string (""), aka nothing. This is the regex way of find-and-delete.
url_content<-gsub('<br />', '', url_content)
Finally I can “read” the data into a data.frame object with the help of read.csv() and textConnection().
In a previous post, I visualized crime density in Boston using R’s ggmap package. In this post, I use ggmap to visualize vehicle accidents in New York City. R code and data are included in this post.
The data comes from NYC Open Data. My data cut ranges from 2012 to 2015. The data tracks the type of vehicle, the name of the street on which the accident occurs, as well as the longitude and latitude coordinates of the accident. Both coordinates are saved as a single character variable called “LOCATION”.
Below, I load the ggmap and gridExtra packages, load the data, drop all accidents without location coordinates, and parse the LOCATION variable to get the longitude and latitude coordinates. I also parse the date variable to create a year variable and use that variable to create two data sets: one with all vehicle accidents in 2013 and another with all vehicle accidents in 2014
Next, I use get_map() to query Google Maps and get a map of NYC. I add a two-dimensional density layer to this map using stat_density2d(). I do this for both 2013 and 2014 data and use gridExtra’s grid.arrange() to place the maps side by side.
Next, I plot 2013 accident densities by borough. I write a function boro() that drops all observations with a missing street name and subsets the 2013 data based on borough. I stack them together while adding borough names, then assign each borough a color in vector col_vals. I use stat_density2d’s group parameter to plot each borough’s density layers separately with different colors.
I noticed that the @rOpenSci folks had an interface to ip-api.com on their ToDo list so I whipped up a small R package to fill said gap.
Their IP Geolocation API will take an IPv4, IPv6 or FQDN and kick back a ASN, lat/lon, address and more. The ipapi package exposes one function – geolocate which takes in a character vector of any mixture of IPv4/6 and domains and returns a data.table of results. Since ip-api.com has a restriction of 250 requests-per-minute, the package also tries to help ensure you don’t get your own IP address banned (there’s a form on their site you can fill in to get it unbanned if you do happen to hit the limit). Overall, there’s nothing fancy in the package, but it gets the job done.
I notified the rOpenSci folks about it, so hopefully it’ll be one less thing on that particular to-do list.
You can see it in action in combination with the super-spiffy leaflet htmlwidget:
library(leaflet)library(ipapi)library(maps)# get top 500 domains
sites <-read.csv("http://moz.com/top500/domains/csv", stringsAsFactors=FALSE)# make reproducibleset.seed(1492)# pick out a random 50
sites <-sample(sites$URL, 50)
sites <-gsub("/", "", sites)
locations <- geolocate(sites)# take a quick look
dplyr::glimpse(locations)## Observations: 50## Variables:## $ as (fctr) AS2635 Automattic, Inc, AS15169 Google Inc., AS3561...## $ city (fctr) San Francisco, Mountain View, Chesterfield, Mountai...## $ country (fctr) United States, United States, United States, United...## $ countryCode (fctr) US, US, US, US, US, US, JP, US, US, IT, US, US, US,...## $ isp (fctr) Automattic, Google, Savvis, Google, Level 3 Communi...## $ lat (dbl) 37.7484, 37.4192, 38.6631, 37.4192, 38.0000, 33.7516...## $ lon (dbl) -122.4156, -122.0574, -90.5771, -122.0574, -97.0000,...## $ org (fctr) Automattic, Google, Savvis, Google, AddThis, Peer 1...## $ query (fctr) 192.0.80.242, 74.125.227.239, 206.132.6.134, 74.125...## $ region (fctr) CA, CA, MO, CA, , GA, 13, MA, TX, , MA, TX, CA, , ,...## $ regionName (fctr) California, California, Missouri, California, , Geo...## $ status (fctr) success, success, success, success, success, succes...## $ timezone (fctr) America/Los_Angeles, America/Los_Angeles, America/C...## $ zip (fctr) 94110, 94043, 63017, 94043, , 30303, , 02142, 78218...# all i want is the world!
world <- map("world", fill = TRUE, plot= FALSE)# kick out a a widget
leaflet(data=world)%>%
addTiles()%>%
addCircleMarkers(locations$lon, locations$lat,
color ='#ff0000', popup=sites)
50 Random Top Sites
To leave a comment for the author, please follow the link and comment on his blog: rud.is » R.
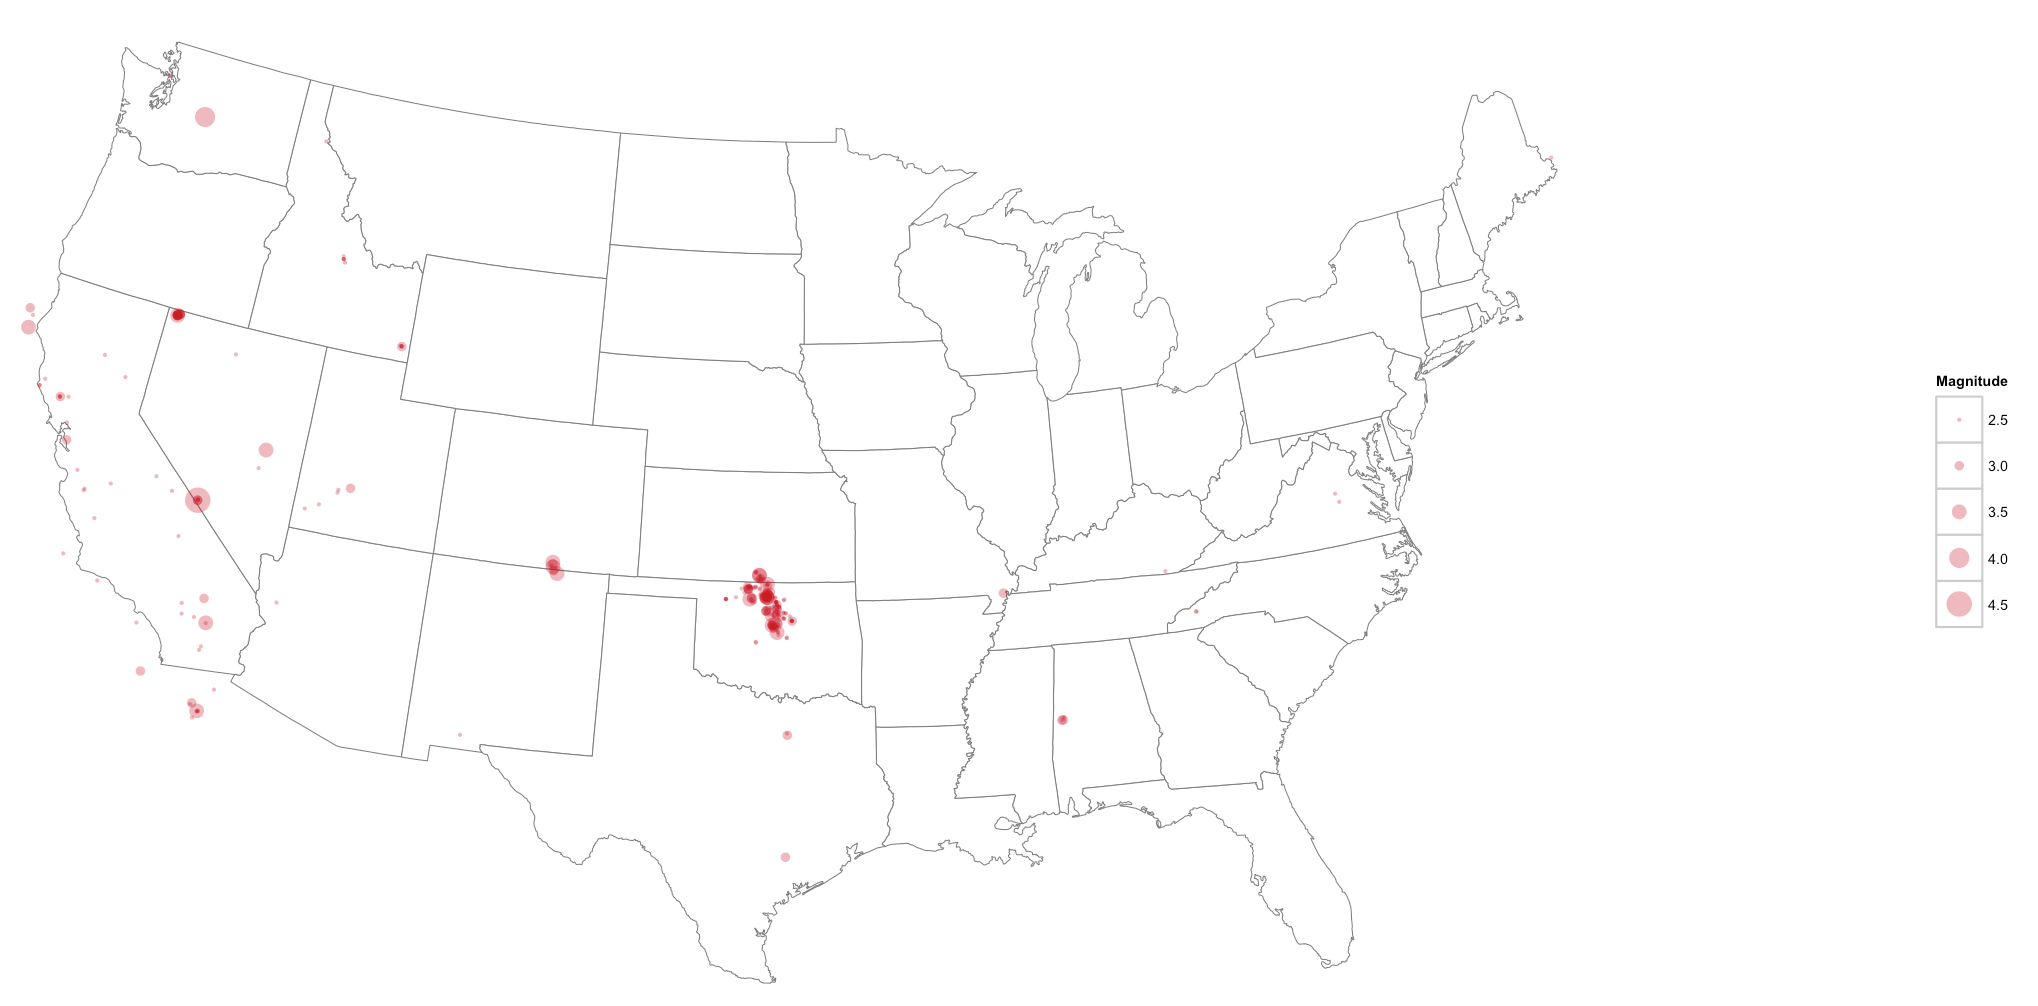
I’ve been seeing an uptick in static US “lower 48″ maps with “meh” projections this year, possibly caused by a flood of new folks resolving to learn R but using pretty old documentation or tutorials. I’ve also been seeing an uptick in folks needing to geocode US city/state to lat/lon. I thought I’d tackle both in a quick post to show how to (simply) use a decent projection for lower 48 US maps and then how to use a very basic package I wrote – localgeo to avoid having to use an external API/service for basic city/state geocoding.
Albers All The Way
I could just plot an Albers projected map, but it’s more fun to add some data. We’ll start with some setup libraries and then read in some recent earthquake data, then filter it for our map display:
library(ggplot2)library(dplyr)library(readr)# devtools::install_github("hadley/readr")# Earthquakes -------------------------------------------------------------# get quake data ----------------------------------------------------------quakes<- read_csv("http://earthquake.usgs.gov/earthquakes/feed/v1.0/summary/2.5_month.csv")# filter all but lower 48 US ----------------------------------------------quakes%>%filter(latitude>=24.396308, latitude<=49.384358,
longitude>=-124.848974, longitude<=-66.885444)->quakes# bin by .5 ---------------------------------------------------------------quakes$Magnitude <-as.numeric(as.character(cut(quakes$mag, breaks=c(2.5, 3, 3.5, 4, 4.5, 5),
labels=c(2.5, 3, 3.5, 4, 4.5), include.lowest=TRUE)))
Many of my mapping posts use quite a few R geo libraries, but this one just needs ggplot2. We extract the US map data, turn it into something ggplot can work with, then plot our quakes on the map:
There are many APIs with corresponding R packages/functions to perform geocoding (one really spiffy recent one is geocodeHERE). While Nokia’s service is less restrictive than Google’s, most of these sites are going to have some kind of restriction on the number of calls per second/minute/day. You could always install the Data Science Toolkit locally (note: it was down as of the original posting of this blog) and perform the geocoding locally, but it does take some effort (and space/memory) to setup and get going.
If you have relatively clean data and only need city/state resolution, you can use a package I made – localgeo as an alternative. I took a US Gov census shapefile and extracted city, state, lat, lon into a data frame and put a lightweight function shim over it (it’s doing nothing more than dplyr::left_join). It won’t handle nuances like “St. Paul, MN” == “Saint Paul, MN” and, for now, it requires you to do the city/state splitting, but I’ll be tweaking it over the year to be a bit more forgiving.
We can give this a go and map the greenest cities in the US in 2014 as crowned by, er, Nerd Wallet. I went for “small data file with city/state in it”, so if you know of a better source I’ll gladly use it instead. Nerd Wallet used DataWrapper, so getting the actual data was easy and here’s a small example of how to get the file, perform the local geocoding and use an Albers projection for plotting the points. The code below assumes you’re still in the R session that used some of the library calls earlier in the post.
Let me reinforce that the localgeo package will most assuredly fail to geocode some city/state combinations. I’m looking for a more comprehensive shapefile to ensure I have the complete list of cities and I’ll be adding some code to help make the lookups more forgiving. It may at least help when you bump into an API limit and need to crank out something in a hurry.
To leave a comment for the author, please follow the link and comment on his blog: rud.is » R.
Machine learning is a branch in computer science that studies the design of algorithms that can learn. Typical machine learning tasks are concept learning, function learning or “predictive modeling”, clustering and finding predictive patterns. These tasks are learned through available data that were observed through experiences or instructions, for example. Machine learning hopes that including the experience into its tasks will eventually improve the learning. The ultimate goal is to improve the learning in such a way that it becomes automatic, so that humans like ourselves don't need to interfere any more.
Machine learning has close ties with Knowledge Discovery, Data Mining, Artificial Intelligence and Statistics. Typical applications of machine learning can be classified into scientific knowledge discovery and more commercial applications, ranging from the “Robot Scientist” to anti-spam filtering and recommender systems.
This small tutorial is meant to introduce you to the basics of machine learning in R: it will show you how to use R to work with the well-known machine learning algorithm called “KNN” or k-nearest neighbors.
Using R For k-Nearest Neighbors (KNN)
The KNN or k-nearest neighbors algorithm is one of the simplest machine learning algorithms and is an example of instance-based learning, where new data are classified based on stored, labeled instances. More specifically, the distance between the stored data and the new instance is calculated by means of some kind of a similarity measure. This similarity measure is typically expressed by a distance measure such as the Euclidean distance, cosine similarity or the Manhattan distance. In other words, the similarity to the data that was already in the system is calculated for any new data point that you input into the system. Then, you use this similarity value to perform predictive modeling. Predictive modeling is either classification, assigning a label or a class to the new instance, or regression, assigning a value to the new instance. Whether you classify or assign a value to the new instance depends of course on your how you compose your model with KNN.
The k-nearest neighbor algorithm adds to this basic algorithm that after the distance of the new point to all stored data points has been calculated, the distance values are sorted and the k-nearest neighbors are determined. The labels of these neighbors are gathered and a majority vote or weighted vote is used for classification or regression purposes. In other words, the higher the score for a certain data point that was already stored, the more likely that the new instance will receive the same classification as that of the neighbor. In the case of regression, the value that will be assigned to the new data point is the mean of its k nearest neighbors.
Step One. Get Your Data
Machine learning typically starts from observed data. You can take your own data set or browse through other sources to find one.
Built-in Datasets of R
This tutorial makes use of the Iris data set, which is well-known in the area of machine learning. This dataset is built into R, so you can take a look at this dataset by typing the following into your console:
iris
UC Irvine Machine Learning Repository
If you want to download the data set instead of using the one that is built into R, you can go to the UC Irvine Machine Learning Repository and look up the Iris data set.
Tip not only check out the data folder of the Iris data set, but also take a look at the data description page!
Then, load in the data set with the following command:
The command reads the .csv or “Comma Separated Value” file from the website. The header argument has been put to FALSE, which means that the Iris data set from this source does not give you the attribute names of the data.
Instead of the attribute names, you might see strange column names such as “V1” or “V2”. Those are set at random. To simplify the working with the data set, it is a good idea to make one yourself: you can do this through the function names(), which gets or sets the names of an object. Concatenate the names of the attributes as you would like them to appear. For the Iris data set, you can use the following R command:
Now that you have loaded the Iris data set into RStudio, you should try to get a thorough understanding of what your data is about. Just looking or reading about your data is certainly not enough to get started!
Initial Overview Of The Data Set
First, you can already try to get an idea of your data by making some graphs, such as histograms or boxplots. In this case, however, scatter plots can give you a great idea of what you're dealing with: it can be interesting to see how much one variable is affected by another. In other words, you want to see if there is any correlation between two variables.
You can make scatterplots with the ggvis package, for example. You first need to load the ggvis package:
library(ggvis)
iris %>% ggvis(~Sepal.Length, ~Sepal.Width, fill = ~Species) %>% layer_points()
You see that there is a high correlation between the sepal length and the sepal width of the Setosa iris flowers, while the correlation is somewhat less high for the Virginica and Versicolor flowers.
The scatter plot that maps the petal length and the petal width tells a similar story:
iris %>% ggvis(~Petal.Length, ~Petal.Width, fill = ~Species) %>% layer_points()
You see that this graph indicates a positive correlation between the petal length and the petal width for all different species that are included into the Iris data set.
After a general visualized overview of the data, you can also view the data set by entering
iris
However, as you will see from the result of this command, this really isn't the best way to inspect your data set thoroughly: the data set takes up a lot of space in the console, which will impede you from forming a clear idea about your data. It is therefore a better idea to inspect the data set by executing
head(iris)
or
str(iris)
Tip try both of these commands out to see the difference!.
Note that the last command will help you to clearly distinguish the data type num and the three levels of the Species attribute, which is a factor. This is very convenient, since many R machine learning classifiers require that the target feature is coded as a factor.
Remember: factor variables represent categorical variables in R. They can thus take on a limited number of different values.
A quick look at the Species attribute through tells you that the division of the species of flowers is 50-50-50:
table(iris$Species)
If you want to check the percentual division of the Species attribute, you can ask for a table of proportions:
Note that the round argument rounds the values of the first argument, prop.table(table(iris$Species))*100 to the specified number of digitis, which is one digit after the decimal point. You can easily adjust this by changing the value of the digits argument.
Profound Understanding Of Your Data
Let's not remain on this high-level overview of the data! R gives you the opportunity to go more in-depth with the summary() function. This will give you the minimum value, first quantile, median, mean, third quantile and maximum value of the data set Iris for numeric data types. For the class variable, the count of factors will be returned:
summary(iris)
##   Sepal.Length   Sepal.Width    Petal.Length   Petal.Width
##  Min.   :4.30   Min.   :2.00   Min.   :1.00   Min.   :0.1
##  1st Qu.:5.10   1st Qu.:2.80   1st Qu.:1.60   1st Qu.:0.3
##  Median :5.80   Median :3.00   Median :4.35   Median :1.3
##  Mean   :5.84   Mean   :3.05   Mean   :3.76   Mean   :1.2
##  3rd Qu.:6.40   3rd Qu.:3.30   3rd Qu.:5.10   3rd Qu.:1.8
##  Max.   :7.90   Max.   :4.40   Max.   :6.90   Max.   :2.5
##             Species
##  Iris-setosa    :50
##  Iris-versicolor:50
##  Iris-virginica :50
##
##
##
You can also refine your summary overview by adding specific attributes to the command that was presented above:
As you can see, the c() function is added to the original command: the columns petal width and sepal width are concatenated and a summary is then asked of just these two columns of the Iris data set.
Step Three. Where to Go Now.
After you have acquired a good understanding of your data, you have to decide on the use cases that would be relevant for your data set. In other words, you think about what your data set might teach you or what you think you can learn from your data. From there on, you can think about what kind of algorithms you would be able to apply to your data set in order to get the results that you think you can obtain.
Tip keep in mind that the more familiar you are with your data, the easier it will be to assess the use cases for your specific data set. The same also holds for finding the appropriate machine algorithm.
For this tutorial, the Iris data set will be used for classification, which is an example of predictive modeling. The last attribute of the data set, Species, will be the target variable or the variable that we want to predict in this example.
Note that the round that you can also take one of the numerical classes as the target variable if you want to use KNN to do regression.
Step Four. Prepare Your Workspace
Many of the algorithms used in machine learning are not incorporated by default into R. You will most probably need to download the packages that you want to use when you want to get started with machine learning.
Tip got an idea of which learning algorithm you may use, but not of which package you want or need? You can find a pretty complete overview of all the packages that are used in R right here.
To illustrate the KNN algorithm, this tutorial works with the package class. You can type in
library(class)
If you don't have this package yet, you can quickly and easily do so by typing
install.packages("<package name>")
if you're not sure if you have this package, you can run the following command to find out!
any(grepl("<name of your package>", installed.packages()))
Step Five. Prepare Your Data
Normalization
As a part of your data preparation, you might need to normalize your data so that its consistent. For this introductory tutorial, just remember that normalization makes it easier for the KNN algorithm to learn. There are two types of normalization:
example normalization is the adjustment of each example individually,
feature normalization indicates that you adjust each feature in the same way across all examples.
So when do you need to normalize your dataset? In short: when you suspect that the data is not consistent. You can easily see this when you go through the results of the summary() function. Look at the minimum and maximum values of all the (numerical) attributes. If you see that one attribute has a wide range of values, you will need to normalize your dataset, because this means that the distance will be dominated by this feature. For example, if your dataset has just two attributes, X and Y, and X has values that range from 1 to 1000, while Y has values that only go from 1 to 100, then Y's influence on the distance function will usually be overpowered by X's influence. When you normalize, you actually adjust the range of all features, so that distances between variables with larger ranges will not be over-emphasised.
Tip go back to the result of summary(iris) and try to figure out if normalization is necessary.
The Iris data set doesn't need to be normalized: the Sepal.Length attribute has values that go from 4.3 to 7.9 and Sepal.Width contains values from 2 to 4.4, while Petal.Length's values range from 1 to 6.9 and Petal.Width goes from 0.1 to 2.5. All values of all attributes are contained within the range of 0.1 and 7.9, which you can consider acceptable.
Nevertheless, it's still a good idea to study normalization and its effect, especially if you're new to machine learning. You can perform feature normalization, for example, by first making your own normalize function:
normalize <- function(x) {
num <- x - min(x)
denom <- max(x) - min(x)
return (num/denom)
}
You can then use this argument in another command, where you put the results of the normalization in a data frame through as.data.frame() after the function lapply() returns a list of the same length as the data set that you give in. Each element of that list is the result of the application of the normalize argument to the data set that served as input:
For the Iris dataset, you would have applied the normalize argument on the four numerical attributes of the Iris data set (Sepal.Length, Sepal.Width, Petal.Length, Petal.Width) and put the results in a data frame:
To more thoroughly illustrate the effect of normalization on the data set, compare the following result to the summary of the Iris data set that was given in step two:
summary(iris_norm)
##   Sepal.Length    Sepal.Width     Petal.Length    Petal.Width
##  Min.   :0.000   Min.   :0.000   Min.   :0.000   Min.   :0.0000
##  1st Qu.:0.222   1st Qu.:0.333   1st Qu.:0.102   1st Qu.:0.0833
##  Median :0.417   Median :0.417   Median :0.568   Median :0.5000
##  Mean   :0.429   Mean   :0.439   Mean   :0.468   Mean   :0.4578
##  3rd Qu.:0.583   3rd Qu.:0.542   3rd Qu.:0.695   3rd Qu.:0.7083
##  Max.   :1.000   Max.   :1.000   Max.   :1.000   Max.   :1.0000
Training And Test Sets
In order to assess your model's performance later, you will need to divide the data set into two parts: a training set and a test set. The first is used to train the system, while the second is used to evaluate the learned or trained system. In practice, the division of your data set into a test and a training sets is disjoint: the most common splitting choice is to take 2/3 of your original data set as the training set, while the 1/3 that remains will compose the test set.
One last look on the data set teaches you that if you performed the division of both sets on the data set as is, you would get a training class with all species of “Setosa” and “Versicolor”, but none of “Virginica”. The model would therefore classify all unknown instances as either “Setosa” or “Versicolor”, as it would not be aware of the presence of a third species of flowers in the data. In short, you would get incorrect predictions for the test set.
You thus need to make sure that all three classes of species are present in the training model. What's more, the amount of instances of all three species needs to be present at more or less the same ratio as in your original data set.
To make your training and test sets, you first set a seed. This is a number of R's random number generator. The major advantage of setting a seed is that you can get the same sequence of random numbers whenever you supply the same seed in the random number generator.
set.seed(1234)
Then, you want to make sure that your Iris data set is shuffled and that you have the same ratio between species in your training and test sets. You use the sample() function to take a sample with a size that is set as the number of rows of the Iris data set, or 150. You sample with replacement: you choose from a vector of 2 elements and assign either 1 or 2 to the 150 rows of the Iris data set. The assignment of the elements is subject to probability weights of 0.67 and 0.33.
ind <- sample(2, nrow(iris), replace=TRUE, prob=c(0.67, 0.33))
Note that the replace argument is set to TRUE: this means that you assign a 1 or a 2 to a certain row and then reset the vector of 2 to its original state. This means that, for the next rows in your data set, you can either assign a 1 or a 2, each time again. The probability of choosing a 1 or a 2 should not be proportional to the weights amongst the remaining items, so you specify probability weights.
Remember that you want your training set to be 2/3 of your original data set: that is why you assign “1” with a probability of 0.67 and the “2"s with a probability of 0.33 to the 150 sample rows.
You can then use the sample that is stored in the variable ind to define your training and test sets:
Note that, in addition to the 2/3 and 1/3 proportions specified above, you don't take into account all attributes to form the training and test sets. Specifically, you only take Sepal.Length, Sepal.Width, Petal.Length and Petal.Width. This is because you actually want to predict the fifth attribute, Species: it is your target variable. However, you do want to include it into the KNN algorithm, otherwise there will never be any prediction for it. You therefore need to store the class labels in factor vectors and divide them over the training and test sets.
After all these preparation steps, you have made sure that all your known (training) data is stored. No actual model or learning was performed up until this moment. Now, you want to find the k nearest neighbors of your training set.
An easy way to do these two steps is by using the knn() function, which uses the Euclidian distance measure in order to find the k-nearest neighbours to your new, unknown instance. Here, the k parameter is one that you set yourself. As mentioned before, new instances are classified by looking at the majority vote or weighted vote. In case of classification, the data point with the highest score wins the battle and the unknown instance receives the label of that winning data point. If there is an equal amount of winners, the classification happens randomly.
Note the k parameter is often an odd number to avoid ties in the voting scores.
To build your classifier, you need to take the knn() function and simply add some arguments to it, just like in this example:
You store into iris_pred the knn() function that takes as arguments the training set, the test set, the train labels and the amount of neighbours you want to find with this algorithm. The result of this function is a factor vector with the predicted classes for each row of the test data.
Note that you don't want to insert the test labels: these will be used to see if your model is good at predicting the actual classes of your instances!
You can retrieve the result of the knn() function by typing in the following command:
The result of this command is the factor vector with the predicted classes for each row of the test data.
Step Seven. Evaluation of Your Model
An essential next step in machine learning is the evaluation of your model's performance. In other words, you want to analyze the degree of correctness of the model's predictions. For a more abstract view, you can just compare the results of iris_pred to the test labels that you had defined earlier:
You see that the model makes reasonably accurate predictions, with the exception of one wrong classification in row 29, where "Versicolor” was predicted while the test label is “Virginica”.
This is already some indication of your model's performance, but you might want to go even deeper into your analysis. For this purpose, you can import the package gmodels:
install.packages("package name")
If you have already installed this package, you can simply enter
library(gmodels)
Then you can make a cross tabulation or a contingency table. This type of table is often used to understand the relationship between two variables. In this case, you want to understand how the classes of your test data, stored in iris.testLabels relate to your model that is stored in iris_pred:
CrossTable(x = iris.testLabels, y = iris_pred, prop.chisq=FALSE)
Note that the last argument prop.chisq indicates whether or not the chi-square contribution of each cell is included. The chi-square statistic is the sum of the contributions from each of the individual cells and is used to decide whether the difference between the observed and the expected values is significant.
From this table, you can derive the number of correct and incorrect predictions: one instance from the testing set was labeled Versicolor by the model, while it was actually a flower of species Virginica. You can see this in the first row of the “Virginica” species in the iris.testLabels column. In all other cases, correct predictions were made. You can conclude that the model's performance is good enough and that you don't need to improve the model!
Move On To Big Data
This tutorial was mainly concerned with performing basic machine learning algorithm KNN with the help of R. The Iris data set that was used was small and overviewable; But you can do so much more! If you have experimented enough with the basics presented in this tutorial and other machine learning algorithms, you might want to find it interesting to go further into R and data analysis. DataCamp can help you to take this step .
This week, in Istanbul, for the second training on data science, we’ve been discussing classification and regression models, but also visualisation. Including maps. And we did have a brief introduction to the leaflet package,
To see what can be done with that package, we will use one more time the John Snow’s cholera dataset, discussed in previous posts (one to get a visualisation on a google map background, and the second one on an openstreetmap background),
Once installed the leaflet package, we can use the package at the RStudio console (which is what we will do here), or within R Markdown documents, and within Shiny applications. But because of restriction we got on this blog (rules of hypotheses.org) So there will be only copies of my screen. But if you run the code, in RStudio you will get interactvive maps in the viewer window.
First step. To load a map, centered initially in London, use
m = leaflet()%>% addTiles()
m %>% fitBounds(-.141,  51.511, -.133, 51.516)
Image may be NSFW. Clik here to view.
In the viewer window of RStudio, it is just like on OpenStreetMap, e.g. we can zoom-in, or zoom-out (with the standard + and – in the top left corner)
Image may be NSFW. Clik here to view.
And we can add additional material, such as the location of the deaths from cholera (since we now have the same coordinate representation system here)
rd=.5
op=.8
clr="blue"
m = leaflet() %>% addTiles()
m %>% addCircles(lng,lat, radius = rd,opacity=op,col=clr)
Copies of my RStudio screen is nice, but visualising it is just awesome. I will try to find a way to load that map on my blog, but it might be difficult (so far, it is possible to visualise it on http://rpubs.com/freakonometrics/)
The genomation package is a toolkit for annotation and visualization of various genomic data. The package is currently in developmental version of BioC. It allows to analyze high-throughput data, including bisulfite sequencing data. Here, we will visualize the distribution of CpG methylation around promoters and their locations within gene structures on human chromosome 3.
Heatmap and plot of meta-profiles of CpG methylation around promoters
In this example we use data from Reduced Representation Bisulfite Sequencing (RRBS) and Whole-genome Bisulfite Sequencing (WGBS) techniques and H1 and IMR90 cell types derived from the ENCODE and the Roadmap Epigenomics Project databases.
We download the datasets and convert them to GRanges objects. Using rtracklayer and genomation functions. We also use a refseq bed file for annotation and extraction of promoter regions using readTranscriptFeatures function.
Since we have read the files now we can build base-pair resolution matrices of scores(methylation values) for each experiment. The returned list of matrices can be used to draw heatmaps or meta profiles of methylation ratio around promoters.
genomation facilitates visualization of given locations of features aggregated by exons, introns, promoters and TSSs. To find the distribution of covered CpGs within these gene structures, we will use transcript features we previously obtained. Here is the breakdown of the code
Count overlap statistics between our CpGs from WGBS and RRBS H1 cell type and gene structures
Calculate percentage of CpGs overlapping with annotation
Today I will walk through an analysis of San Francisco Zip Code Demographics using my new R package choroplethrZip. This package creates choropleth maps of US Zip Codes and connects to the US Census Bureau. A choropleth is a map that shows boundaries of regions (such as zip codes) and colors those regions according to some metric (such as population).
Zip codes are a common geographic unit for businesses to work with, but rendering them is difficult. Official zip codes are maintained by the US Postal Service, but they exist solely to facilitate mail delivery. The USPS does not release a map of them, they change frequently and, in some cases, are not even polygons. The most authoritative map I could find of US Zip codes was the Census Bureau’s Map of Zip Code Tabulated Areas (ZCTAs). Despite shipping with only a simplified version of this map (60MB instead of 500MB), choroplethrZip is still too large for CRAN. It is instead hosted on github, and you can install it from an R console like this:
The package vignettes (1, 2) explain basic usage. In this article I’d like to demonstrate a more in depth example: showing racial and financial characteristics of each zip code in San Francisco. The data I use comes from the 2013 American Community Survey (ACS) which is run by the US Census Bureau. If you are new to the ACS you might want to view my vignette on Mapping US Census Data.
Example: Race and Ethnicity
One table that deals with race and ethnicity is B03002 - Hipanic or Latino Origin by Race. Many people will be surprised by the large number of categories. This is because the US Census Bureau has a complex framework for categorizing race and ethnicity. Since my purpose here is to demonstrate technology, I will simplify the data by only dealing with only a handful of the values: Total Hispanic or Latino, White (not Hispanic), Black (not Hispanic) and Asian (not Hispanic).
The R code for getting this data into a data.frame can be viewed here, and the code for generating the graphs in this post can be viewed here. Here is a boxplot of the ethnic breakdown of the 27 ZCTAs in San Francisco.
This boxplot shows that there is a wide variation in the racial and ethnic breakdown of San Francisco ZCTAs. For example, the percentage of White people in each ZCTA ranges from 7% to 80%. The percentage of black and hispanics seem to have a tighter range, but also contains outliers. Also, while Asian Americans only make up the 5% of the total US population, the median ZCTA in SF is 30% Asian.
Viewing this data with choropleth maps allows us to associate locations with these values.
The range of this dataset - from $15,960 to $144,400 - is striking. Equally striking is the outlier at the top. We can use a continuous scale choropleth to highlight the outlier. We can also use a four color choropleth to show the locations of the quartiles.
The outlier for income is zip 94105, which is where a large number of tech companies are located. The zips in the southern part of the city tend to have a low income.
Further Exploration: Interactive Analysis with Shiny
After viewing this analysis readers might wish to do a similar analysis for the city where they live. To facilitate this I have created an interactive web application. The app begins by showing a choropleth map of a random statistic of the Zips in a random Metropolitan Statistical Area (MSA). You can choose another statistic, zoom in, or select another MSA.
In the event that the application does not load (for example, if I reach my monthly quota at my hosting company) then you can run the app from source, which is available here.
Conclusion
I hope that you have enjoyed this exploration of Zip code level demographics with choroplethrZip. I also hope that it encourages more people to use R for demographic statistics.
Ari Lamstein is a software engineer and data analyst in San Francisco. He blogs at Just an R Blog.
Image may be NSFW. Clik here to view.
To leave a comment for the author, please follow the link and comment on his blog: Revolutions.
One of the things I’ve been trying to explore with my #f1datajunkie projects are ways of representing information that work both in a glanceable way as well as repaying deeper reading. I’ve also been looking at various ways of using text labels rather than markers to provide additional information around particular data points.
For example, in a race battlemap, with lap number on the horizontal x-axis and gap time on the vertical y-axis, I use a text label to indicate which driver is ahead (or behind) a particular target driver.
In the revised version of this chart type shown in F1 Malaysia, 2015 – Rosberg’s View of the Race, and additional numerical label along the x-axis indicatesd the race position of the target driver at the end of each lap.
What these charts are intended to do is help the eye see particular structural shapes within the data – for example whether a particular driver is being attacked from behind in the example of a battlemap, or whether they are catching the car ahead (perhaps with intervening cars in the way – although more needs to be done on the chart with respect to this for examples where there are several intervening cars; currently, only a single intervening car immediately ahead on track is shown.)
Two closer readings of the chart are then possible. Firstly, by looking at the y-value we can see the actual time a car is ahead (and here the dashed guide line at +/1 1s helps indicate in a glanceable way the DRS activation line; I’m also pondering how to show an indication of pit loss time to indicate what effect a pit stop might have on the current situation). Secondly, we can read off the labels of the drivers involved i a battle to get a more detailed picture of the race situation.
The latest type of chart I’ve been looking at are session utilisation maps, which in their simplest form look something like the following:
The charts show how each driver made use of a practice session or qualifying – drivers are listed on the vertical y-axis and the time into the session each lap was recorded at is identified along the horizontal x-axis.
This chart makes it easy to see how many stints, and of what length, were completed by each driver and at what point in the session. Other information might be inferred – for example, significant gaps in which no cars are recording times may indicate poor weather conditions or red flags. However, no information is provided about the times recorded for each lap.
We can, however, use colour to identify “purple” laps (fastest lap time recorded so far in the session) and “green” laps (a driver’s fastest laptime so far in the session that isn’t a purple time), as well as laps on which a driver pitted:
One thing to note about laptimes is that they come in various flavours, such as outlaps, when a driver starts the lap from the pitlane; inlaps, or laps on which a driver comes into the pits at the end of the lap; and flying laps when a driver is properly going for it. There are also those laps on which a driver may be trying out various new lines, slowing down to give themselves space for a flying lap, and so on.
Assuming that inlaps and outlaps are not the best indicators of pace, we can use a blend of symbols and text labels on the chart to identify inlaps and outlaps, as well as showing laptimes for “racing” laps, also using colour to highlight purple and green laps:
The chart is produced using ggplot, and a layered approach in which chart elements are added to the chart in separate layers.
#The base chart with the dataset used to create the original chart
#In this case, the dataset included here is redundant
g = ggplot(f12015test)

#Layer showing in-laps (laps on which a driver pitted) and out-laps
#Use a subset of the dataset to place markers for outlaps and inlaps
g = g + geom_point(data=f12015test[f12015test['outlap'] | f12015test['pit'],],aes(x=cuml, y=name, color=factor(colourx)), pch=1)

#Further annotation to explicitly identify pit laps (in-laps)
g = g + geom_point(data=f12015test[f12015test['pit']==TRUE,],aes(x=cuml, y=name),pch='.')

#Layer showing full laps with rounded laptimes and green/purple lap highlights
#In this case, use the laptime value as a text label, rather than a symbol marker
g = g + geom_text(data=f12015test[!f12015test['outlap'] & !f12015test['pit'],],aes(x=cuml, y=name, label=round(stime,1), color=factor(colourx)), size=2, angle=45)

#Force the colour scale to be one we want
g = g + scale_colour_manual(values=c('darkgrey','darkgreen','purple'))
This version of the chart has the advantage of being glanceable when it comes to identifying session utilisation (number, duration and timing of stints) as well as when purple and green laptimes were recorded, as well as repaying closer reading when it comes to inspecting the actual laptimes recorded during each stint.
To reduce clutter on the chart, laptimes are round to 1 decimal place (tenths of a second) rather than using the full lap time which is recorded down to thousandths of a second.
Session utilisation charts are described more fully in a forthcoming chapter of the Wrangling F1 Data With R Leanpub book. Buying a copy of the book gains you access to future updates of the book. A draft version of the chapter can be found here.
In February the WSJ graphics team put together a series of interactive visualisations on the impact of vaccination that blew up on twitter and facebook, and were roundly lauded as great-looking and effective dataviz. Some of these had enough data available to look particularly good, such as for the measles vaccine:
Credit to the WSJ and creators: Tynan DeBold and Dov Friedman
How hard would it be to recreate an R version?
Base R version
Quite recently Mick Watson, a computational biologist based here in Edinburgh, put together a base R version of this figure using heatmap.2 from the gplots package.
If you’re interested in the code for this, I suggest you check out his blog post where he walks the reader through creating the figure, beginning from heatmap defaults.
However, it didn’t take long for someone to pipe up asking for a ggplot2 version (3 minutes in fact…) and that’s my preference too, so I decided to have a go at putting one together.
ggplot2 version
Thankfully the hard work of tracking down the data had already been done for me, to get at it follow these steps:
It’s a bit crude but what I’m doing is summing the weekly incidence rates and leaving NAs if there’s no data for a whole year. This seems to match what’s been done in the WSJ article, though a more intepretable method could be something like average weekly incidence, as used by Robert Allison in his SAS version.
After trying to match colours via the OS X utility “digital colour meter” without much success, I instead grabbed the colours and breaks from the original plot’s javascript to make them as close as possible.
In full, the actual ggplot2 command took a fair bit of tweaking:
Image may be NSFW. Clik here to view.I’m pretty happy with the outcome but there are a few differences: the ordering is out (someone pointed out the original is ordered by two letter code rather than full state name) and the fonts are off (as far as I can tell they use “Whitney ScreenSmart” among others).
Obviously the original is an interactive chart which works great with this data. It turns out it was built with the highcharts library, which actually has R bindings via the rCharts package, so in theory the original chart could be entirely recreated in R! However, for now at least, that’ll be left as an exercise for the reader…
At our most recent R user group meeting we were delighted to have presentations from Mark Lawson and Steve Hoang, both bioinformaticians at Hemoshear. All of the code used in both demos is in our Meetup’s GitHub repo.
Making heatmaps in R
Steve started with an overview of making heatmaps in R. Using the iris dataset, Steve demonstrated making heatmaps of the continuous iris data using the heatmap.2 function from the gplots package, the aheatmap function from NMF, and the hard way using ggplot2. The “best in class” method used aheatmap to draw an annotated heatmap plotting z-scores of columns and annotated rows instead of raw values, using the Pearson correlation instead of Euclidean distance as the distance metric.
Mark wrapped up with a gentle introduction to the caret package for classification and regression training. This demonstration used the caret package to split data into training and testing sets, and run repeated cross-validation to train random forest and penalized logistic regression models for classifying Fisher’s iris data.
First, get a look at the data with the featurePlot function in the caret package:
Next, after splitting the data into training and testing sets and using the caret package to automate training and testing both random forest and partial least squares models using repeated 10-fold cross-validation (see the code), it turns out random forest outperforms PLS in this case, and performs fairly well overall:
setosa
versicolor
virginica
Sensitivity
1.00
1.00
0.00
Specificity
1.00
0.50
1.00
Pos Pred Value
1.00
0.50
NaN
Neg Pred Value
1.00
1.00
0.67
Prevalence
0.33
0.33
0.33
Detection Rate
0.33
0.33
0.00
Detection Prevalence
0.33
0.67
0.00
Balanced Accuracy
1.00
0.75
0.50
A big thanks to Mark and Steve at Hemoshear for putting this together!
To leave a comment for the author, please follow the link and comment on his blog: Getting Genetics Done.
Last week, Mick Watson posted a terrific article on using R to recreate the visualizations in this WSJ article on the impact of vaccination. Someone beat me to the obvious joke.
Why then would I even bother to write this post. Well, because I did things a little differently; diversity of opinion and illustration of alternative approaches are good. And because on the internet, it’s quite acceptable to appropriate great ideas from other people when you lack any inspiration yourself. And because I devoted much of Friday morning to it.
Here then is my “exploration of what Mick did already, only using ggplot2 like Ben did already.”
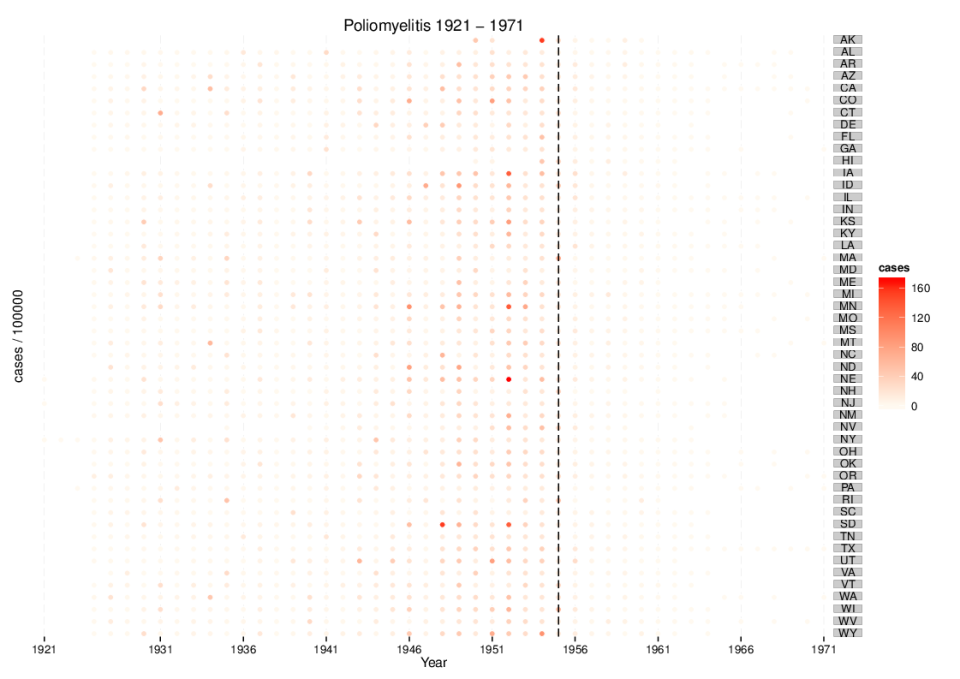
You know what: since we’re close to the 60th anniversary of Salk’s polio vaccine field trial results, let’s do poliomyelitis instead of measles. And let’s normalise cases per 100 000 population, since Mick and Ben did not. There, I claim novelty.
1. Getting the disease data
Follow Mick’s instructions, substituting POLIOMYELITIS for MEASLES. The result is a CSV file. Except: the first 2 lines are not CSV and the header row contains an extra blank field (empty quotes), not found in the data rows. The simplest way to deal with this was to use read.csv(), which auto-creates the extra column (62), calls it “X” and fills it with NA. You can then ignore it. Here’s a function to read the CSV file and aggregate cases by year.
head(polio)
          state YEAR value
1      NEBRASKA 1921     1
2    NEW.JERSEY 1921     1
3      NEW.YORK 1921    40
4      NEW.YORK 1922     2
5 MASSACHUSETTS 1923     1
6      NEW.YORK 1923     8
2. Getting the population data
I discovered US state population estimates for the years 1900 – 1990 at the US Census Bureau. The URLs are HTTPS, but omitting the “s” works fine. The data are plain text…which is good but…although the data are somewhat structured (delimited), the files themselves vary a lot. Some contain only estimates, others contain in addition census counts. For earlier decades the numbers are thousands with a comma (so “1,200” = 1 200 000). Later files use millions with no comma. The decade years are split over several lines with different numbers of lines before and inbetween.
To make a long story short, any function to read these files requires many parameters to take all this into account and it looks like this:
So now we can create a list of data frames, one per decade, then use plyr::join_all to join on state and get a big date frame of 51 states x 91 years with population estimates.
3. Joining the datasets
Next step: join the disease and population data. Although we specified states in the original data download, it includes things that are not states like “UPSTATE.NEW.YORK”, “DISTRICT.OF.COLUMBIA” or “PUERTO.RICO”. So let’s restrict ourselves to the 50 states helpfully supplied as variables in R. First we create a data frame containing state names and abbreviations, then match the abbreviations to the polio data.
Now we can melt the population data, join to the polio data on state abbreviation and calculate cases per 100 000 people.
popn.m <- melt(popn.df)
colnames(popn.m) <- c("abb", "YEAR", "pop")
popn.m$YEAR <- as.numeric(as.character(popn.m$YEAR))
polio.pop <- join(polio, popn.m, by = c("YEAR", "abb"))
polio.pop$cases <- (100000 / polio.pop$pop) * polio.pop$value

head(polio.pop)
          state YEAR value abb      pop      cases
1      NEBRASKA 1921     1  NE  1309000 0.07639419
2    NEW.JERSEY 1921     1  NJ  3297000 0.03033060
3      NEW.YORK 1921    40  NY 10416000 0.38402458
4      NEW.YORK 1922     2  NY 10589000 0.01888752
5 MASSACHUSETTS 1923     1  MA  4057000 0.02464876
6      NEW.YORK 1923     8  NY 10752000 0.07440476
Success! Let’s get plotting.
4. Plotting
We should really indicate where data are missing but for the purposes of this post, I’ll just drop incomplete rows using na.omit().
Technically my first attempt is an abuse of geom_dotplot, but I think it generates quite a nice effect (assuming you’re not colour-blind). Note that years have to be factorised here.
Finally, let’s try the colour palette generated by Mick. From his post, it’s clear that the WSJ fiddled with bin sizes and break points to generate more yellow/orange/red for pre-vaccine years. I haven’t bothered with that here, so things look a little different.
Summary
Not too much work for some quite attractive output, thanks to great R packages; Hadley, love your work.
As ever, the main challenge is getting the raw data into shape. At some point I’ll wrap all this up as Rmarkdown and send it off to RPubs.
In
Part I
of this series, I explained how R hashed environments are superior
to vectors or lists when you’re in need of an associative array. In
Part II
I explained the three main operations you want to perform on hash tables
and how you should implement them for optimal performance.
This time around I want to introduce a package I’ve created that “peaks behind the curtain” of R environments, which I’ll use later to evaluate more performance characteristics.
Under Envestigation
The envestigate package
exposes the hash table and its statistics that back the R environment. I
consider this an experimental package so I don’t intend to
push it to CRAN any time soon. However it properly uses the R C API and
was developed the proper way, so it should
work on any late model R version across all platforms.
library(devtools) # Make sure you've already installed this
install_github('jeffreyhorner/envestigate')
library(envestigate)
Hash Table Implementation
Hash tables are commonly implemented as an array of buckets with each bucket containing a linked list. They use a hash function to compute an index into the array of buckets so that the correct value can be found. A perfect hash function ‘hashes’ each key to a unique bucket to store the value, but they are rarely perfect. It is stated that when two keys hash to the same bucket a collision occures, and collisions are resolved by traversing the bucket’s linked list until the correct value is found.
In R, environment hash tables are a vector of lists where each
element of the list contains a binding from symbol to value. The
envestigate::hash_table function transforms that structure into a list
of character vectors where each element contains only the symbol name as a string and
ignores the value, thus exposing the internal structure so we can explore:
 # e - an environment who's hash table has 5 buckets
e <- new.env(size=5L)

e[['Tukey']] <- 1 # Values aren't important
e[['Fisher']] <- 1
e[['Bayes']] <- 1
e[['Pearson']] <- 1

ht <- envestigate::hash_table(e)

# List the bucket contents
ht$buckets
So we see that the internal hash table of 5 buckets has two empty buckets, bucket 2 and 3, and 3 non-empty buckets with bucket 1 containing two elements.
hash_table function
Let’s explore the 'hash_table’ object a little further. The envestigate package provides a simple print function for hash table objects:
size - Number of buckets in the hash table, e.g. the size of the hash table.
num_entries - Total number of entries (or elements or variables) in the hash table.
num_collisions - Total number of collisions, counted as the sum of 1 - length of each list.
num_empty_buckets - Total number of buckets that contain zero elements.
num_non_empty_buckets - Total number of buckets that contain at least one element.
load_factor - Ratio of non empty buckets to size.
max_bucket_length - Length of bucket with the most elements.
And there’s more. The following items are also part of the object but are typically too large for a simple print summary. They are:
buckets - List of the buckets and their associated lists, which we saw above.
empty_buckets - Vector of indexes for the empty buckets.
non_empty_buckets - Vector of indexes for non empty buckets.
bucket_counts - Named intenger vector where names are indexes of and elements are the counts of each bucket.
bucket_size_dist - Data frame histogram of the number of buckets for each unique bucket size.
A note on the load factor. It is typically defined in the literature as the total number of elements (or entries) in the hash table divided by the size of the hash table. However, computing that value requires a complete scan of the table and this can have performance consequenses for instance when the table needs to be resized. So just using a ratio of non empty buckets to size is a cheaper to compute approximation. This is how R determines when to resize a hash table.
Computing Hash Values
envestigate also exposes the hash function that R uses to compute the hash value for strings, values that are used to map the strings to their buckets. Defining hash functions for computing hash values, a well researched topic, is beyond the scope of this note so I’ll just point to R’s implementation
here, authored by Peter J. Weinberger.
The function envestigate::hash_value maps character vectors to integer values:
So those hash values are pretty meaningless at this point as you can tell non of them are in the 1 to 5 range, the size of our hash table. But they are a consistent, reproducible, one to one mapping from unique string to unique value, and we can use that result to compute the bucket index using the %% or modulo operator:
Now we can compute on R’s internal environment hash tables just like R. For instance looking up a variable in an environment is nearly equivalent to this operation for looking up the bucket for the string 'Tukey’:
index <- hash_index('Tukey',ht)
bucket <- ht$buckets[[ index ]]
bucket
## [1] "Bayes" "Tukey"
for (i in 1:length(bucket)){
  if ('Tukey' == bucket[i]){
    cat('Found Tukey in bucket',index,'and list element',i,'!n')
  }
}
## Found Tukey in bucket 1 and list element 2 !
So envestigate away, and share what you come up with!
To leave a comment for the author, please follow the link and comment on his blog: Jeffrey Horner.
The unlucky events that took place in Nepal have flooded the web with visualization of the earthquakes from USGS. They normally visualize earthquakes with a colour scale that depends on the age of the event and a marker size that depends on magnitude. I remembered that some time ago I tested ways for downloading and visualizing data from USG in the same way in R. So I decided to take those tests back, clean them up and publish them. I hope this will not offend anyone, I do not want to disrespect the tragedy, just share my work.
The USGS provides access to csv files for seismic events recording in several time frames: past hour, past day, past week, and in the past 30 days. For each of these, several choices of significance are provided, user can download all the events in the time frame or limit their request to events with magnitude higher than: 1.0, 2.5, 4.5 and significant events. The data are provided in csv files with standard names so that they are always accessible and updated every 15 minutes with new data. USGS provides the csv files in links with standard names. For example in this case we are downloading all the data in the last month, so the csv file’s name is: all_month.csv. If we wanted to download only the earthquakes in the last day and with a magnitude above 4.5, we would have used the file name: 4.5_day.csv. The links to all the csv provided by USGS are available here: http://earthquake.usgs.gov/earthquakes/feed/v1.0/csv.php
For this experiment we need the following packages: sp, plotrix, and raster In R we can easily import the data by simply calling the read.table function and reading the csv file from the server:
This will download all the seismic events in the past 30 days. Now we can transform the data, which are stored in a data.frame, into a spatial object using the following two lines:
The first line transforms the object Earthquake_30Days into a SpatialPointsDataFrame. The second gives it its proper projection, which is a geographical projection like Google Maps. At this point I want to download the borders of all the countries in the world so that I can plot the seismic events with some geographical references:
These three lines can download the border shapefile from the web, unzip it into the working directory and load it. In this example I will visualize the earthquakes using the same technique used by the USGS, with a colour that varies with the age of the event and a size that depends on magnitude. So the first thing to do is take care of the time. If we check the format of the time variable in the USGS file we see that it is a bit uncommon:
Now we can start the tricky part. For plotting the events with a custom colour scale and a custom size scale, we first need to create them. Moreover, we also need to create the thresholds needed for the legend. For the colour scale we can do all that using the following lines:
In the first line I calculate the age of the event as the difference between the system time and the event time-stamp. In the second line I create the colour scale with the function in plotrix, from red to blue and with a certain transparency. Then I need to create the thresholds for the legend. I first create a data.frame with age and colours, then I order it by age and insert an ID column. At this point I can create the thresholds by simply using the seq function. I do the same thing with the size thresholds:
#Title and Legend title("Earthquakes in the last 30 days",cex.main=3) legend.pos <- list(x=-28.52392,y=-20.59119) rect(xleft=legend.pos$x-5, ybottom=legend.pos$y-30, xright=legend.pos$x+30, ytop=legend.pos$y+10, col="white", border=NA) legendg(legend.pos,legend=c(round(colors.DF[colors.DF$ID %in% round(breaks,0),1],2)),fill=paste(colors.DF[colors.DF$ID %in% round(breaks,0),2]),bty="n",bg=c("white"),y.intersp=0.75,title="Age",cex=0.8) text(x=legend.pos$x+5,y=legend.pos$y+5,"Legend:") legend(x=legend.pos$x+15,y=legend.pos$y,legend=breaks.size[2:5]*5,pch=points(rep(legend.pos$x+15,4),c(legend.pos$y-6,legend.pos$y-9,legend.pos$y-12,legend.pos$y-15),pch=16,cex=breaks.size[2:5]),cex=0.8,bty="n",bg=c("white"),y.intersp=1.1,title="Magnitude")
dev.off()
I divided the magnitude by 5, so that the bubbles are not too big. The position of the legends is something that depends of the image, if you decrease the area plotted on the map their location will change and you can use geographical coordinates to change it. The result is the following image:
Data frame df_zip_demographics contains eight demographic statistics about each ZIP Code Tabulated Area (ZCTA) in the US. Data comes from the 2013 5-year American Community Survey (ACS).
Function ?get_zip_demographics will return a data.frame with those same statistics from an arbitrary ACS.
Here is a program which will create national maps of the data:
# for each column in the data.frame
for (i in 2:ncol(df_zip_demographics))
{
 # set the value and title
 df_zip_demographics$value = df_zip_demographics[,i]
 title = paste0("2013 ZCTA Demographics:n",
                colnames(df_zip_demographics[i]))

 # print the map
 choro = zip_choropleth(df_zip_demographics, title=title)
 print(choro)
}
Note that national zip maps can take a few minutes to render. Here is the output.
The list of speakers was impressive (a couple of the presentations approached the sublime), the venue was bright and upscale, the food was good, and some of the best talks ran way over the time limit but somehow the clock slowed down to sync to the schedule.
But the best part of the conference was the vibe! It was a sweet brew of competency, cooperation and fun. The crowd, clearly out to enjoy themselves, provided whatever lift the speakers needed to be at the top of their game. For example, when near the very end of the second day Stefan Karpinsky's PC just "up and died" as he was about to start his Julia to R demo the crowd hung in there with him and Stefan managed an engaging, ad lib, no visuals 20 minute talk. It was also uncanny how the talks seemed to be arranged in just the right order. Mike Dewar, a data scientist with the New York Times, gave the opening presentation which featured some really imaginative and impressive data visualizations that wowed the audience. But Bryan Lewis stole back the thunder, and the applause, later in the morning when as part of his presentation on htmlwidgets he reproduced Dewar's finale viz with mushroom data.
Bryan has posted his slides on his site here along with a promise to post all of the code soon.
The slides from all of the presentations have yet to be posted on the NY R Conference website. So, all I can do here today is to provide an opportunity sample drawn from postings I have managed to find scattered about the web. Here are Winston Chang's talk on Dashboarding with Shiny, Jared Lander's talk on Making R Go Faster and Bigger, Wes McKinney's talk on Data Frames, my talk on Reproducibility with the checkpoint package, and Max Richman's talk on R for Survey Analysis.
For the rest of the presentations, we will have to wait for the slides to become available on the conference site. There is a lot to look forward to: Vivian Peng's presentation on Storytelling and Data Visualization will be worth multiple viewings and you will not want to miss Hilary Parker's hilarious "grand slam" talk on Reproducible Analysis in Production featuring explainR and complainR. But for sure, look for Andrew Gelman's talk: But When You Call Me A Bayesian I Know I'm Not the Only One. Gelman delivered what was possibly the best technical talk ever, but we will have to wait for the conference video to reassess that.
Was Gelman's talk really the best ever, or was it just the magic of his delivery and the mood of the audience that made it seem so? Either way, I'm glad I was there.
To leave a comment for the author, please follow the link and comment on his blog: Revolutions.