(This article was first published on me nugget, and kindly contributed to R-bloggers)

I've also discovered the bathymetry / topography data from GEBCO. Again, very easy to import into R from the netCDF files.
The above map of the Galapagos Archipelago illustrates the quality of both datasets. It also shows the comparison of coastline accuracy between World Vector Shoreline (1:250,000), world (map package), and worldHires (mapdata package) datasets. Obviously, the low-resolution world data only makes sense for quick plotting at large scales, but the high-resolution data is as much as 1/10° off in some locations. I noticed these errors for the first time when trying to map some data for smaller coastal bays. It drove me crazy trying to figure out where the errors were - in my data locations or the map itself. Bathymetry used in the map was 30 arc-second resolution GEBCO data.
A more detailed description export settings:
- Coastline data (from 'Coastline Extractor') :
- Coastline database: World Vector Shoreline (1:250,000)
- Compression method for extracted ASCII data: None
- Coast Format options: Matlab
- Coast Preview options: GMT Plot
- Bathymetry / topography data [link]:
- General Bathymetric Chart of the Oceans (GEBCO) : GEBCO_08 Grid (30 arc-second resolution)
For both maps, I took inspiration for the color palettes from GMT. The rgb color levels of these palettes have got to be documented somwhere, but I gave up looking after a while and managed to hack their levels from color scales contained in .png files [link].
Below is the R code to reproduce the figures.
###required packages
library(RNetCDF)
library(maps)
library(mapdata)

###Data
#data locations
bathy_fname <- "galapagos_gebco_08_-92_-2_-88_2.nc" # from https://www.bodc.ac.uk/data/online_delivery/gebco/gebco_08_grid/
coast_fname <- "galapagos_18563.dat" # from

#load bathy data
nc <- open.nc(bathy_fname)
print.nc(nc)
tmp <- read.nc(nc)
z <- array(tmp$z, dim=tmp$dim)
#z[which(z > 0)] <- NaN
z <- z[,rev(seq(ncol(z)))]
xran <- tmp$x_range
yran <- tmp$y_range
zran <- tmp$z_range
lon <- seq(tmp$x[1], tmp$x[2], tmp$spac[1])
lat <- seq(tmp$y[1], tmp$y[2], tmp$spac[1])
rm(tmp)
close.nc(nc)

#load coast data
coast <- read.table(coast_fname)
names(coast) <- c("lon", "lat")

###Plot
#make palette
ocean.pal <- colorRampPalette(
 c("#000000", "#000413", "#000728", "#002650", "#005E8C",
 "#0096C8", "#45BCBB", "#8AE2AE", "#BCF8B9", "#DBFBDC")
)

land.pal <- colorRampPalette(
 c("#467832", "#887438", "#B19D48", "#DBC758", "#FAE769",
 "#FAEB7E", "#FCED93", "#FCF1A7", "#FCF6C1", "#FDFAE0")
)

zbreaks <- seq(-8000, 8000, by=10)
cols <-c(ocean.pal(sum(zbreaks<=0)-1), land.pal(sum(zbreaks>0)))

#compare coastlines to package 'mapdata'
png("coastline_compare.png", width=7.5, height=6, units="in", res=400)
#quartz(width=7.5, height=6)
layout(matrix(1:2, 1,2), widths=c(6,1.5), heights=c(6))

par(mar=c(2,2,1,1), ps=10)
image(lon, lat, z=z, col=cols, breaks=zbreaks, useRaster=TRUE, ylim=c(-1.5,0.5), xlim=c(-92,-90))
lines(coast, col=1)
map("world", col=2, ylim=c(-2,2), xlim=c(-93,-88), add=TRUE)
map("worldHires", col=3, ylim=c(-2,2), xlim=c(-93,-88), add=TRUE)
legend("bottomleft", legend=c("World Vector Shoreline", "maps: world", "mapdata: worldHires"), lty=1, col=c(1:3), bg="white")

par(mar=c(2,0,1,5))
image(x=1, y=zbreaks, z=matrix(zbreaks, 1, length(zbreaks)), col=cols, breaks=zbreaks, useRaster=TRUE, xlab="", ylab="", axes=FALSE)
axis(4, at=seq(-8000, 8000, 1000), las=2)
mtext("[meters]", side=4, line=3)
box()

dev.off()
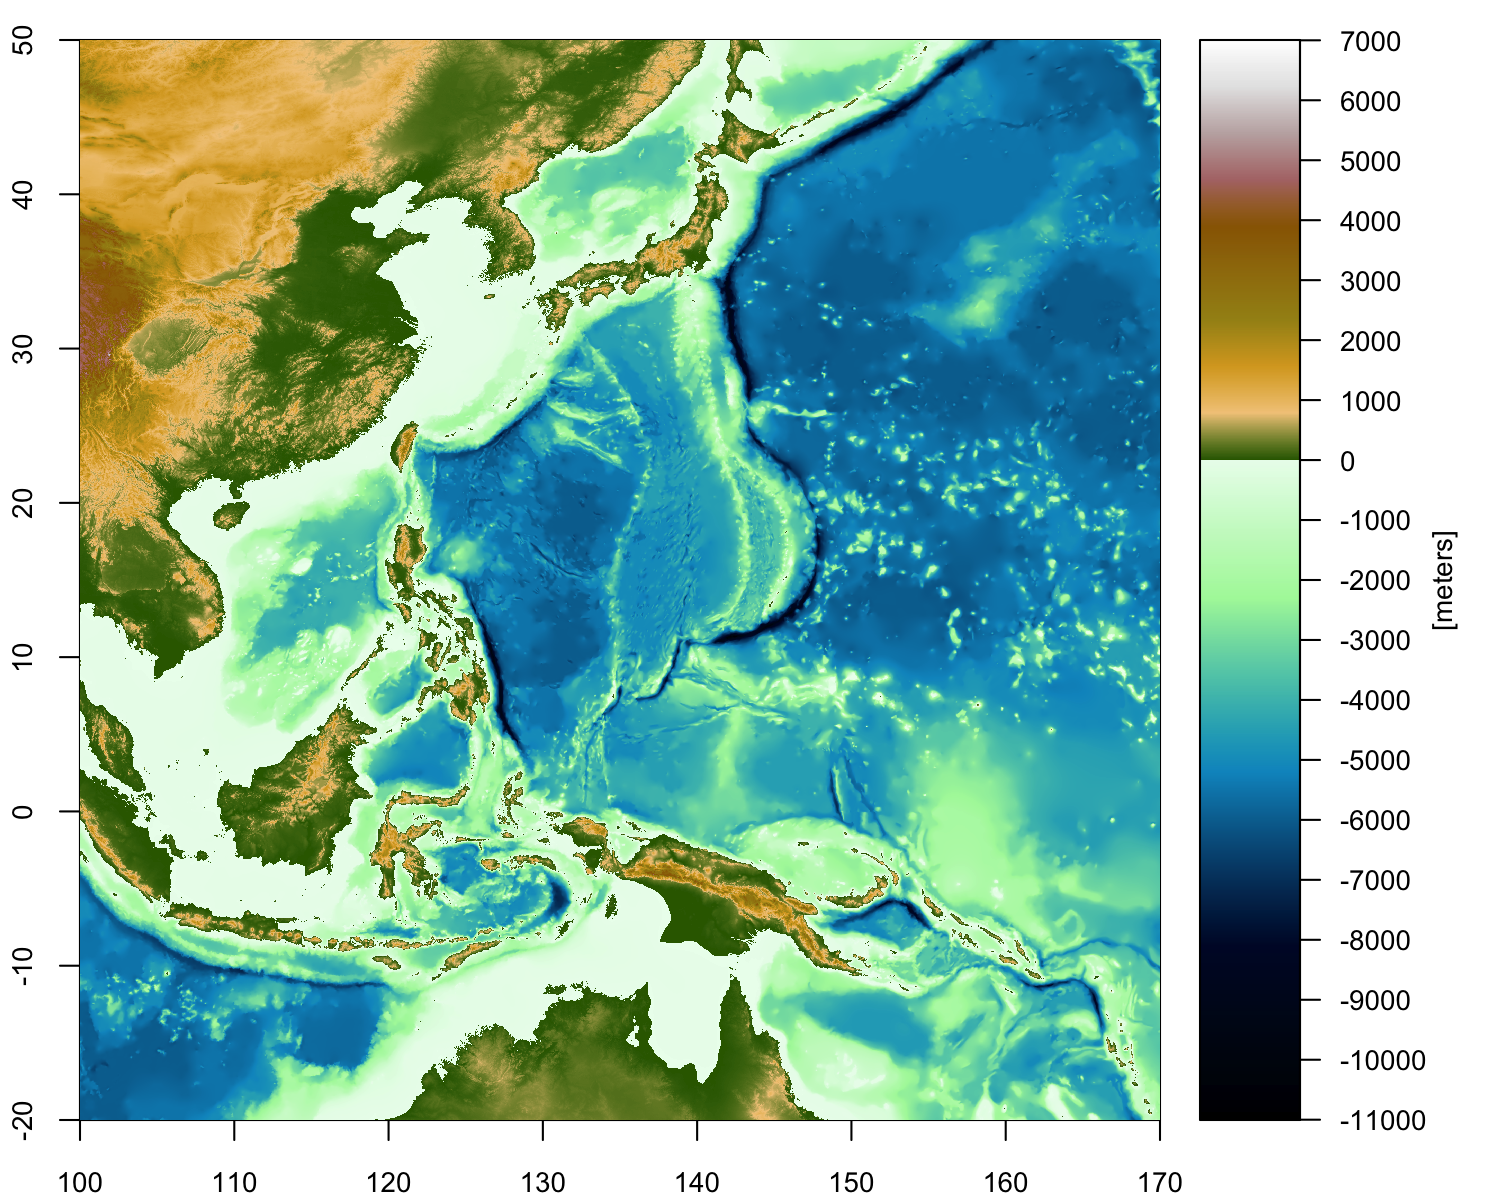
To reproduce western Pacific map:
###required packages
library(RNetCDF)

###Data
#data location
bathy_fname <- "west_pac_gebco_1min_100_-20_170_50.nc" # from https://www.bodc.ac.uk/data/online_delivery/gebco/gebco_08_grid/

#load bathy data
nc <- open.nc(bathy_fname)
print.nc(nc)
tmp <- read.nc(nc)
z <- array(tmp$z, dim=tmp$dim)
#z[which(z > 0)] <- NaN
z <- z[,rev(seq(ncol(z)))]
xran <- tmp$x_range
yran <- tmp$y_range
zran <- tmp$z_range
lon <- seq(tmp$x[1], tmp$x[2], tmp$spac[1])
lat <- seq(tmp$y[1], tmp$y[2], tmp$spac[1])
rm(tmp)
close.nc(nc)

###Plot
#make palette
ocean.pal <- colorRampPalette(
 c("#000000", "#000209", "#000413", "#00061E", "#000728", "#000932", "#002650",
 "#00426E", "#005E8C", "#007AAA", "#0096C8", "#22A9C2", "#45BCBB",
 "#67CFB5", "#8AE2AE", "#ACF6A8", "#BCF8B9", "#CBF9CA", "#DBFBDC",
 "#EBFDED")
)

land.pal <- colorRampPalette(
 c("#336600", "#F3CA89", "#D9A627",
 "#A49019", "#9F7B0D", "#996600", "#B27676", "#C2B0B0", "#E5E5E5",
 "#FFFFFF")
)

zbreaks <- seq(-11000, 7000, by=10)
cols <-c(ocean.pal(sum(zbreaks<=0)-1), land.pal(sum(zbreaks>0)))

#compare coastlines to package 'mapdata'
png("west_pac.png", width=7.5, height=6, units="in", res=200)
#quartz(width=7.5, height=6)
layout(matrix(1:2, 1,2), widths=c(6,1.5), heights=c(6))

par(mar=c(2,2,1,1), ps=10)
image(lon, lat, z=z, col=cols, breaks=zbreaks, useRaster=TRUE, ylim=c(-20,50), xlim=c(100,170))

par(mar=c(2,0,1,5))
image(x=1, y=zbreaks, z=matrix(zbreaks, 1, length(zbreaks)), col=cols, breaks=zbreaks, useRaster=TRUE, xlab="", ylab="", axes=FALSE)
axis(4, at=seq(-11000, 7000, 1000), las=2)
mtext("[meters]", side=4, line=3)
box()

dev.off()
To leave a comment for the author, please follow the link and comment on his blog: me nugget.
R-bloggers.com offers daily e-mail updates about R news and tutorials on topics such as: visualization (ggplot2, Boxplots, maps, animation), programming (RStudio, Sweave, LaTeX, SQL, Eclipse, git, hadoop, Web Scraping) statistics (regression, PCA, time series, trading) and more...